Table of Contents
The web interface is organised according to the concepts described earlier. It is divided in three logical parts: Node Management, Configuration Management and Administration.
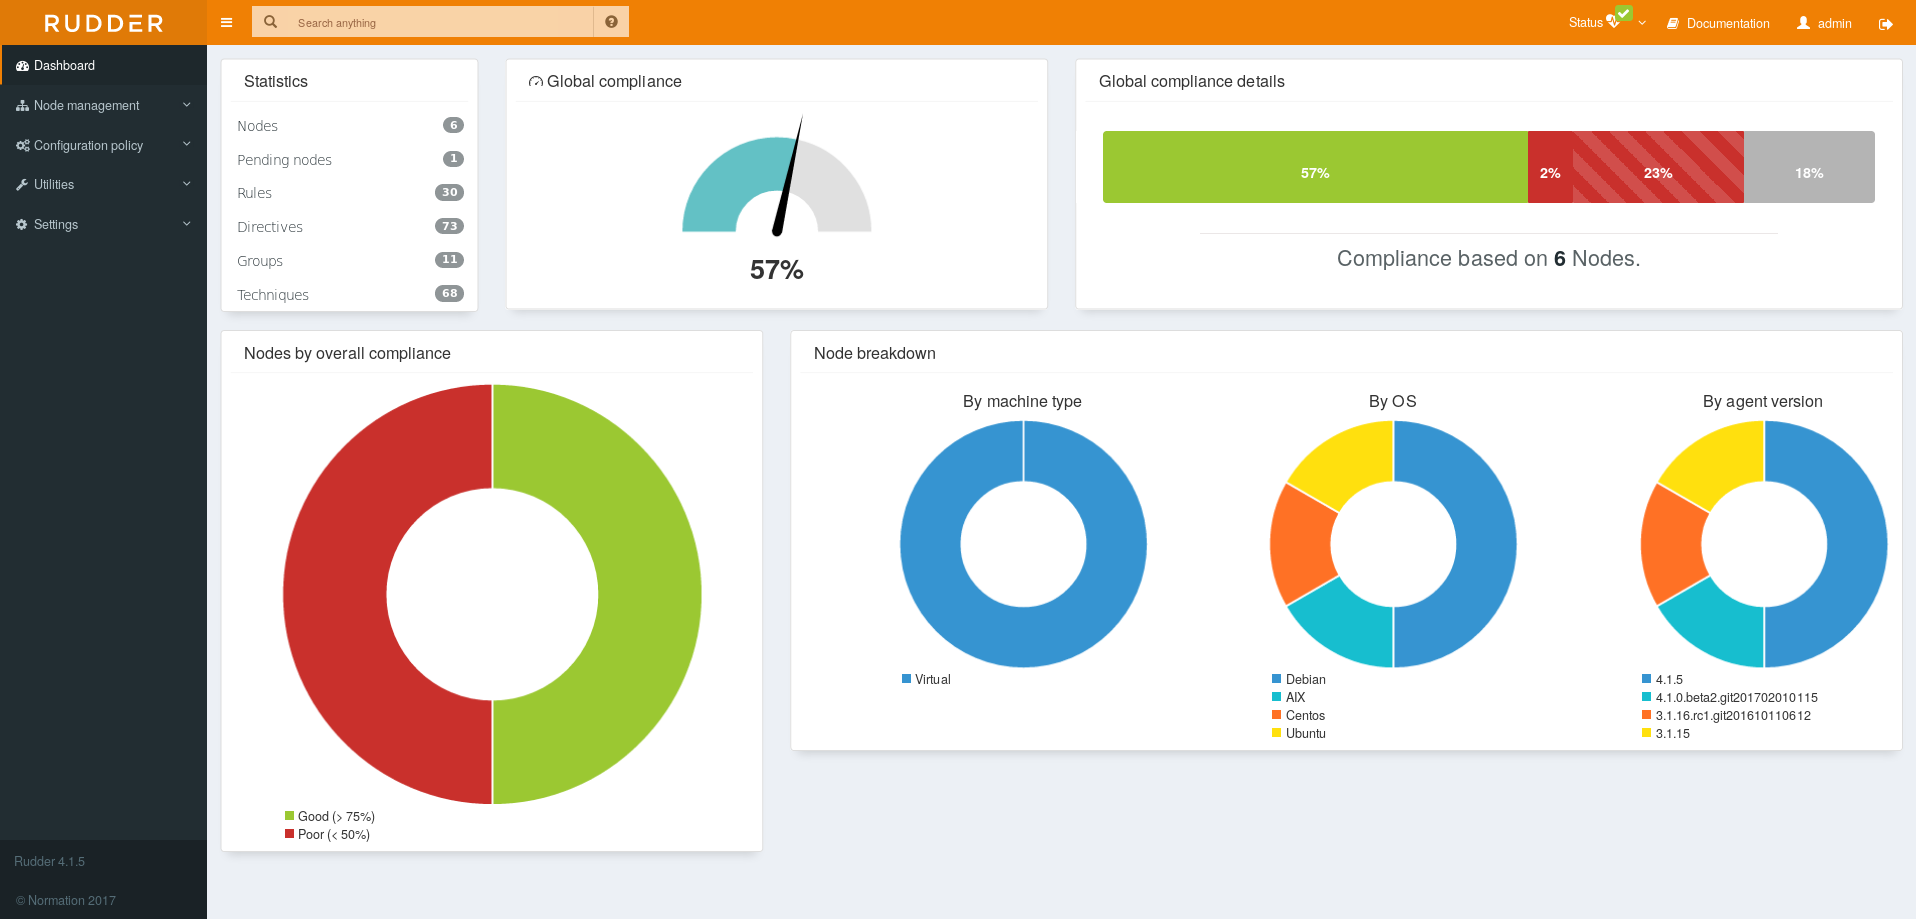
The home page summarizes the content of the other parts and provides quick links for the most common actions.
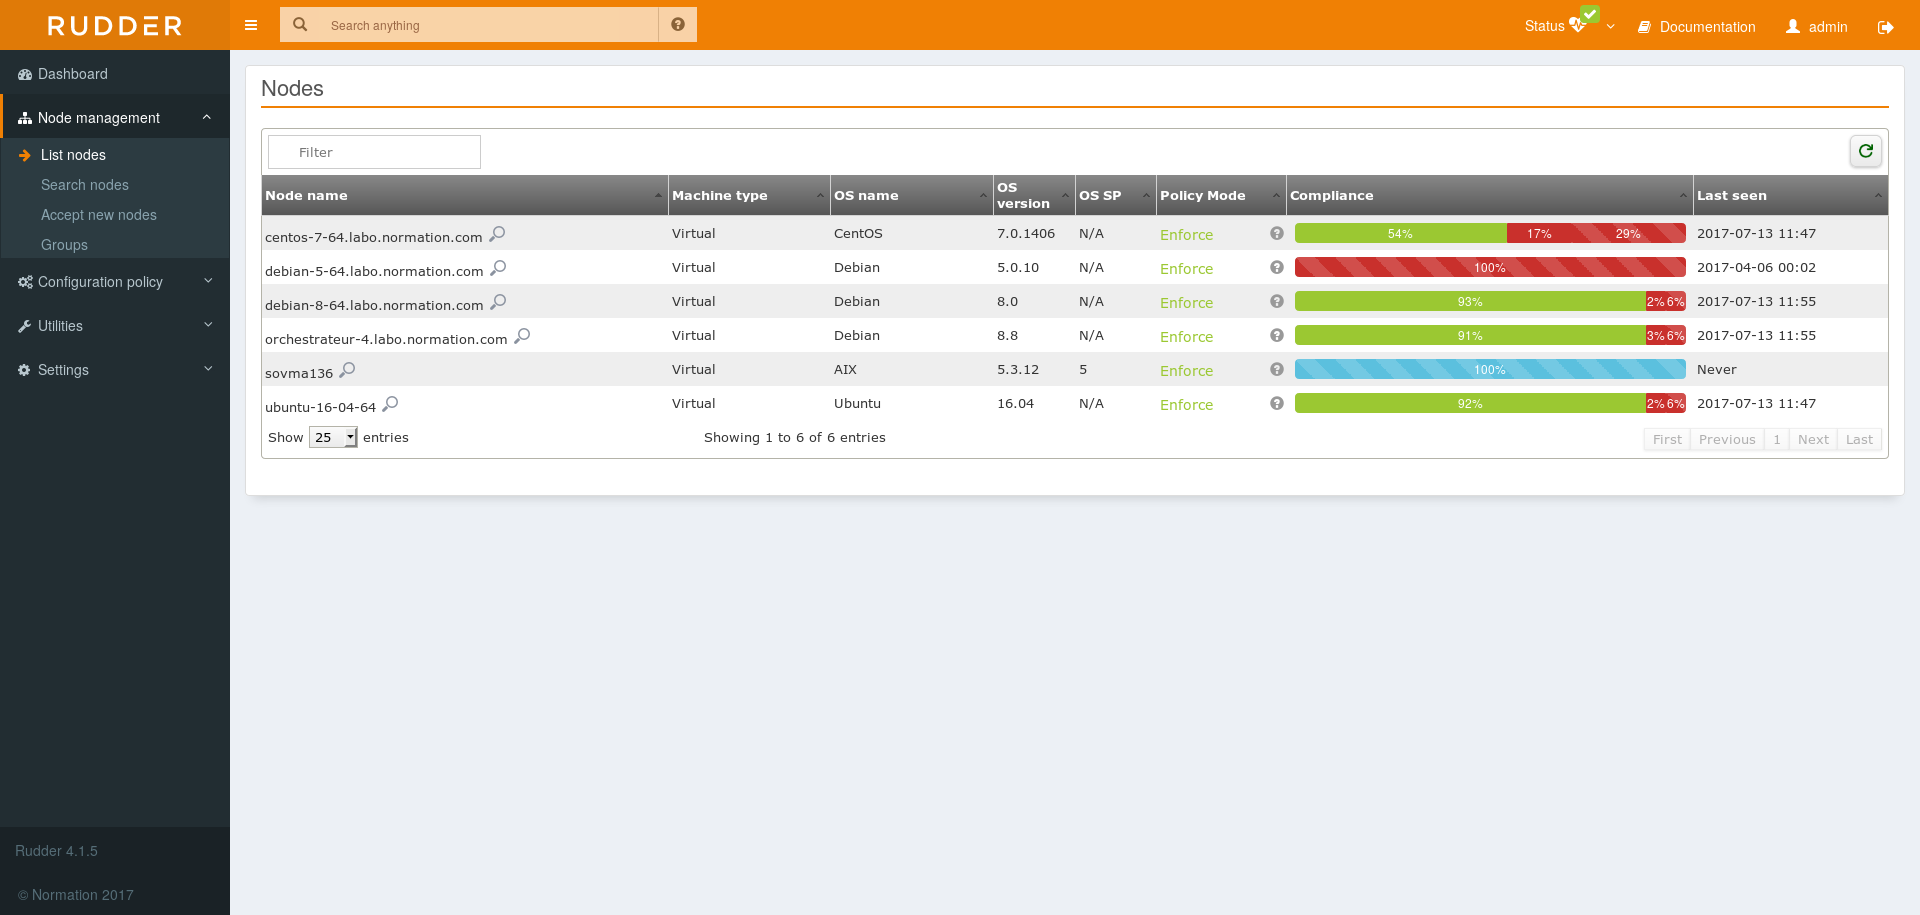
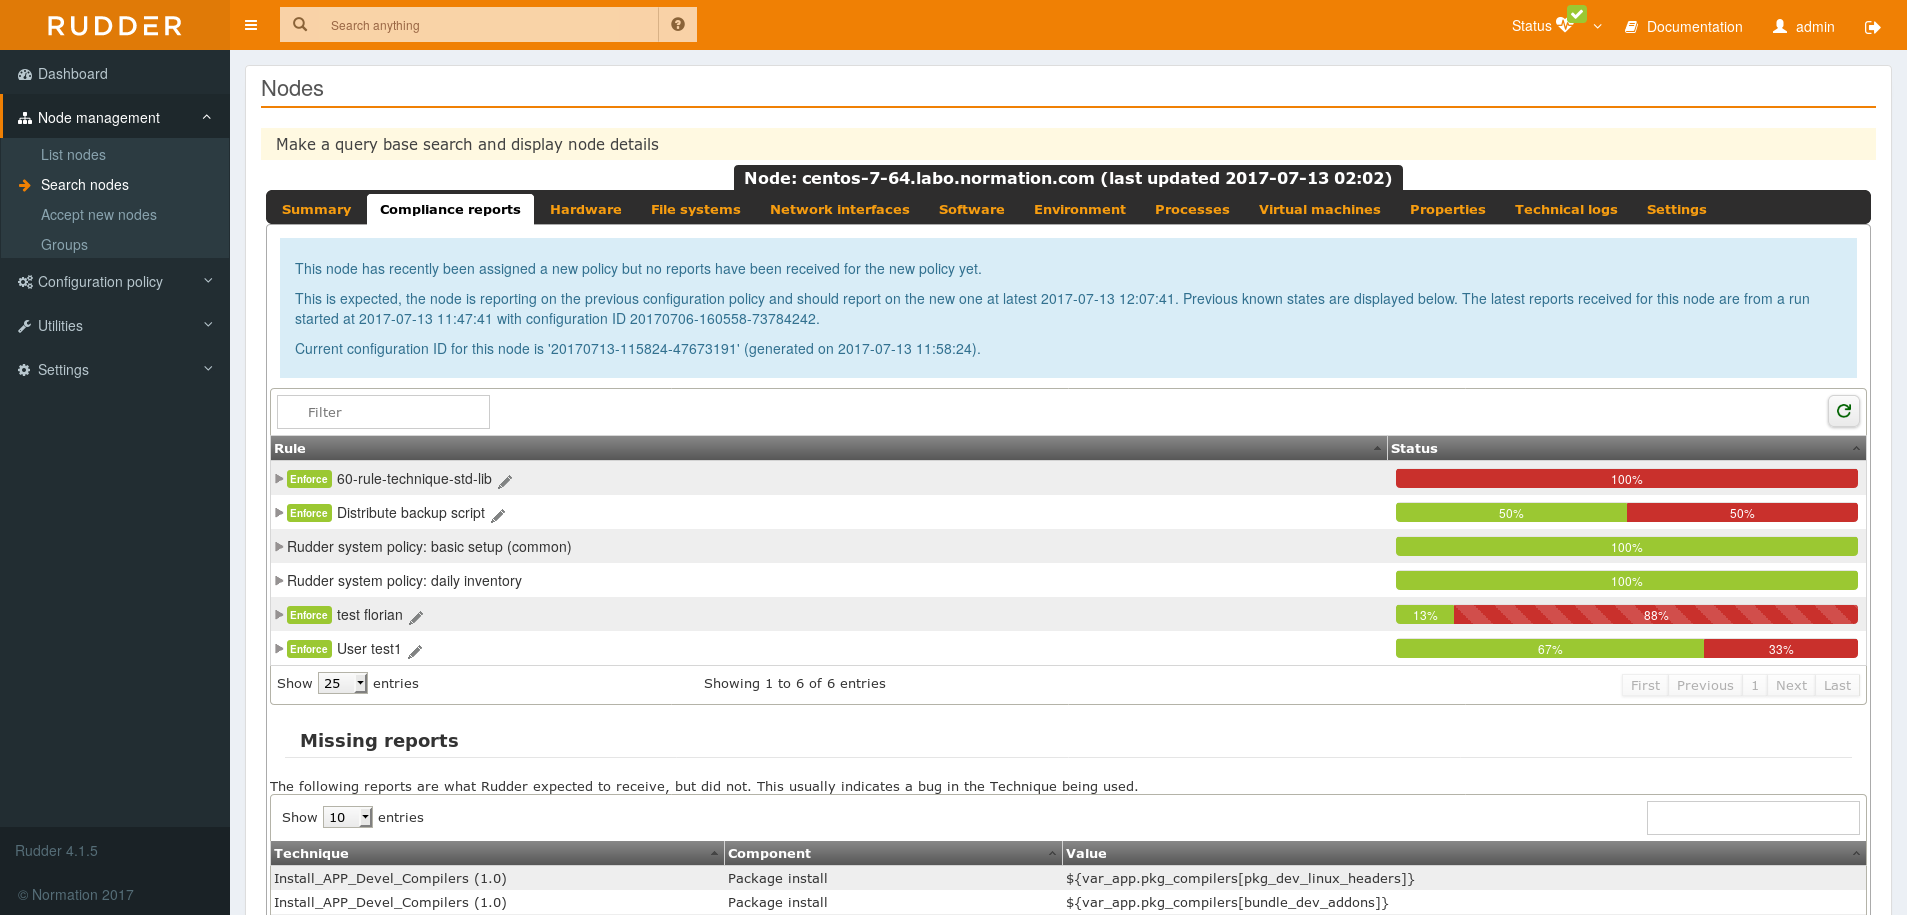
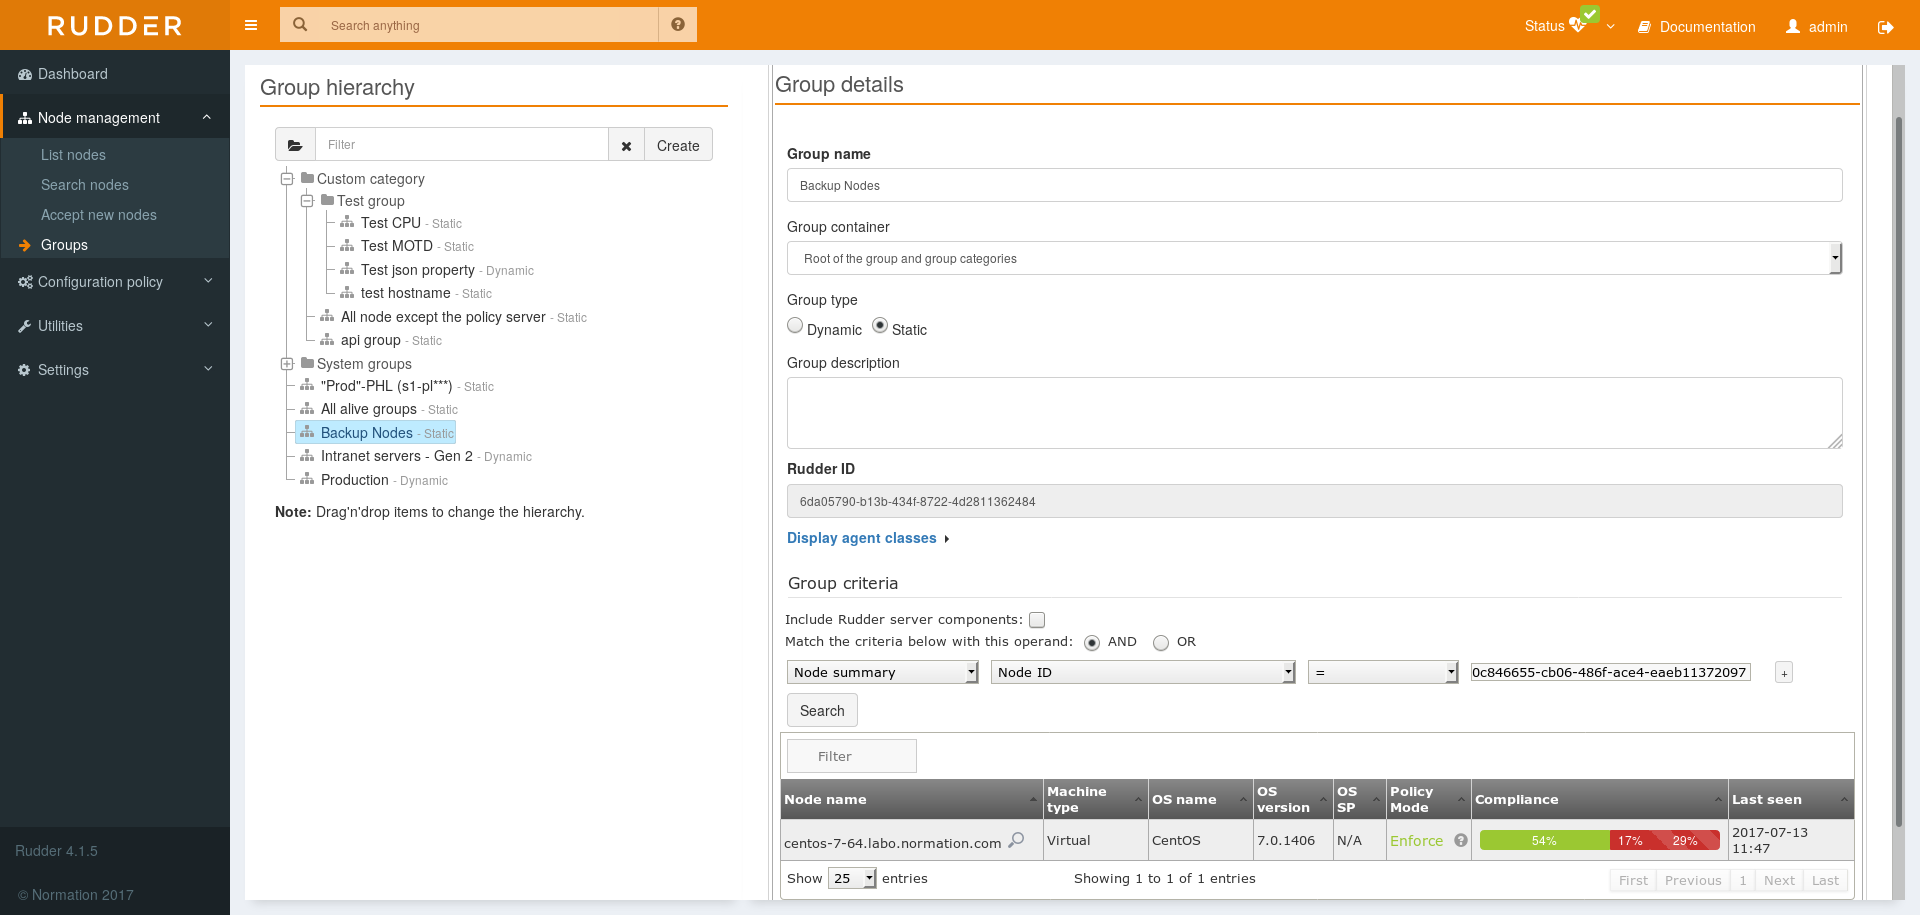
In the Node Management section, you will find the list of all Nodes, the validation tool for new Nodes, a search engine for validated Nodes, and the management tool for groups of Nodes.
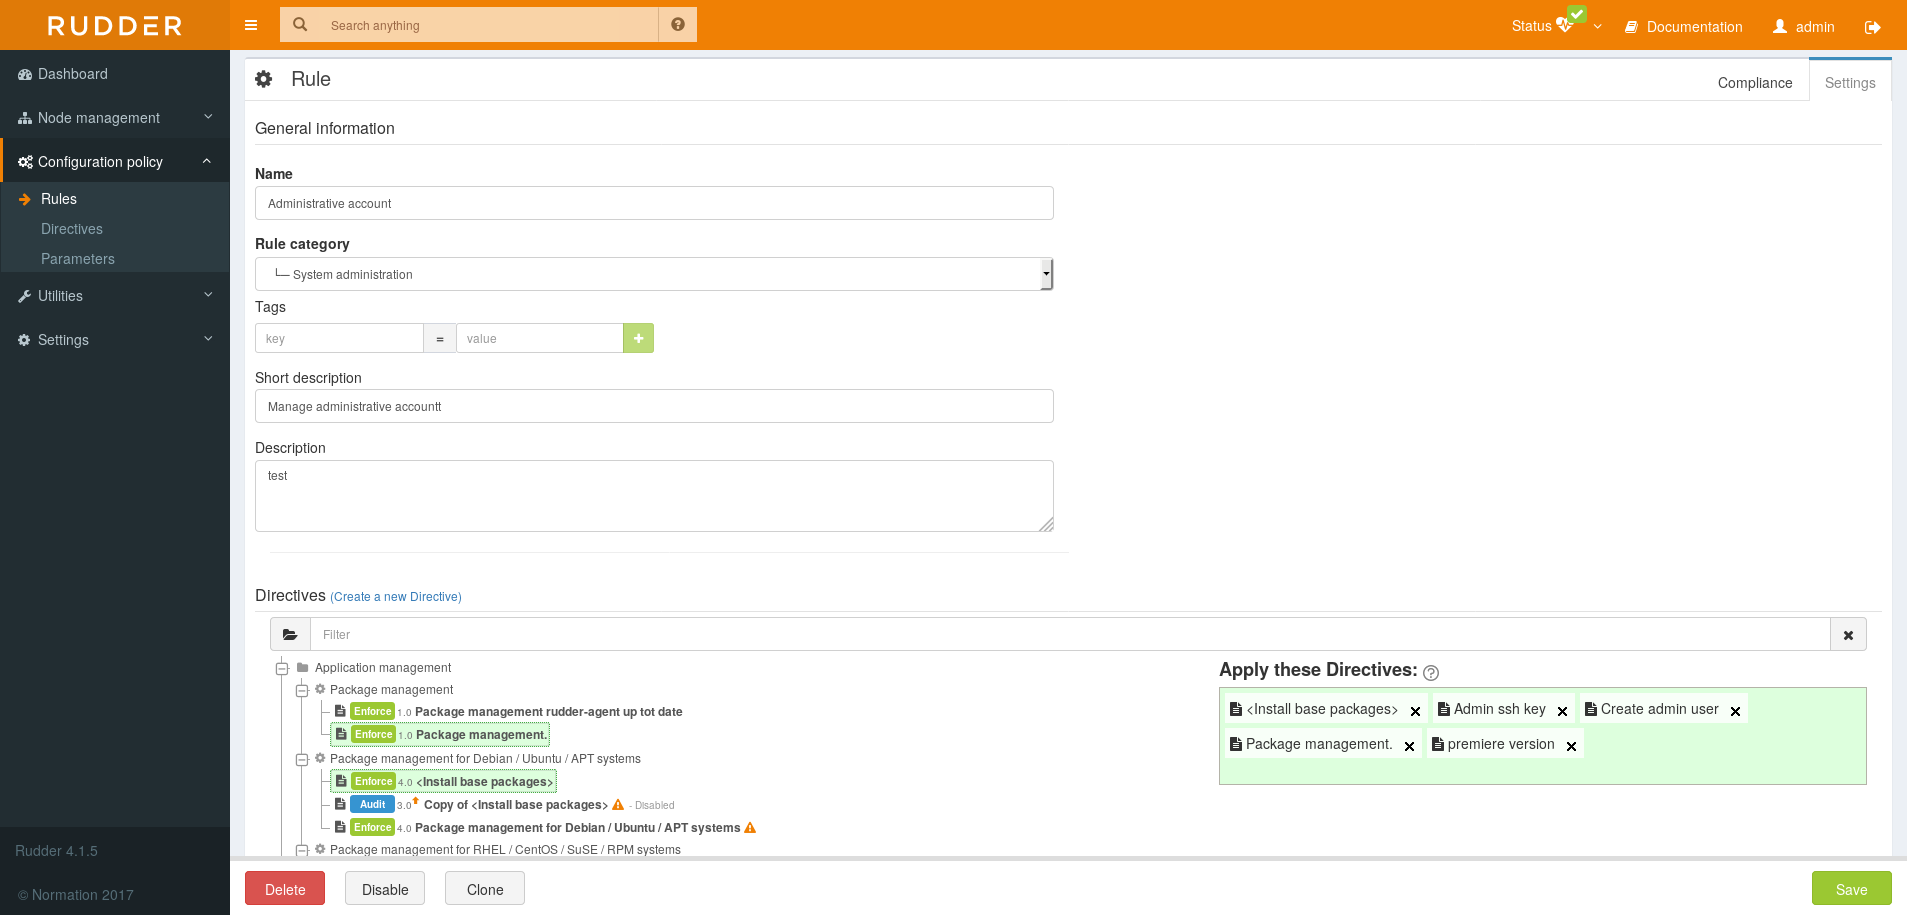
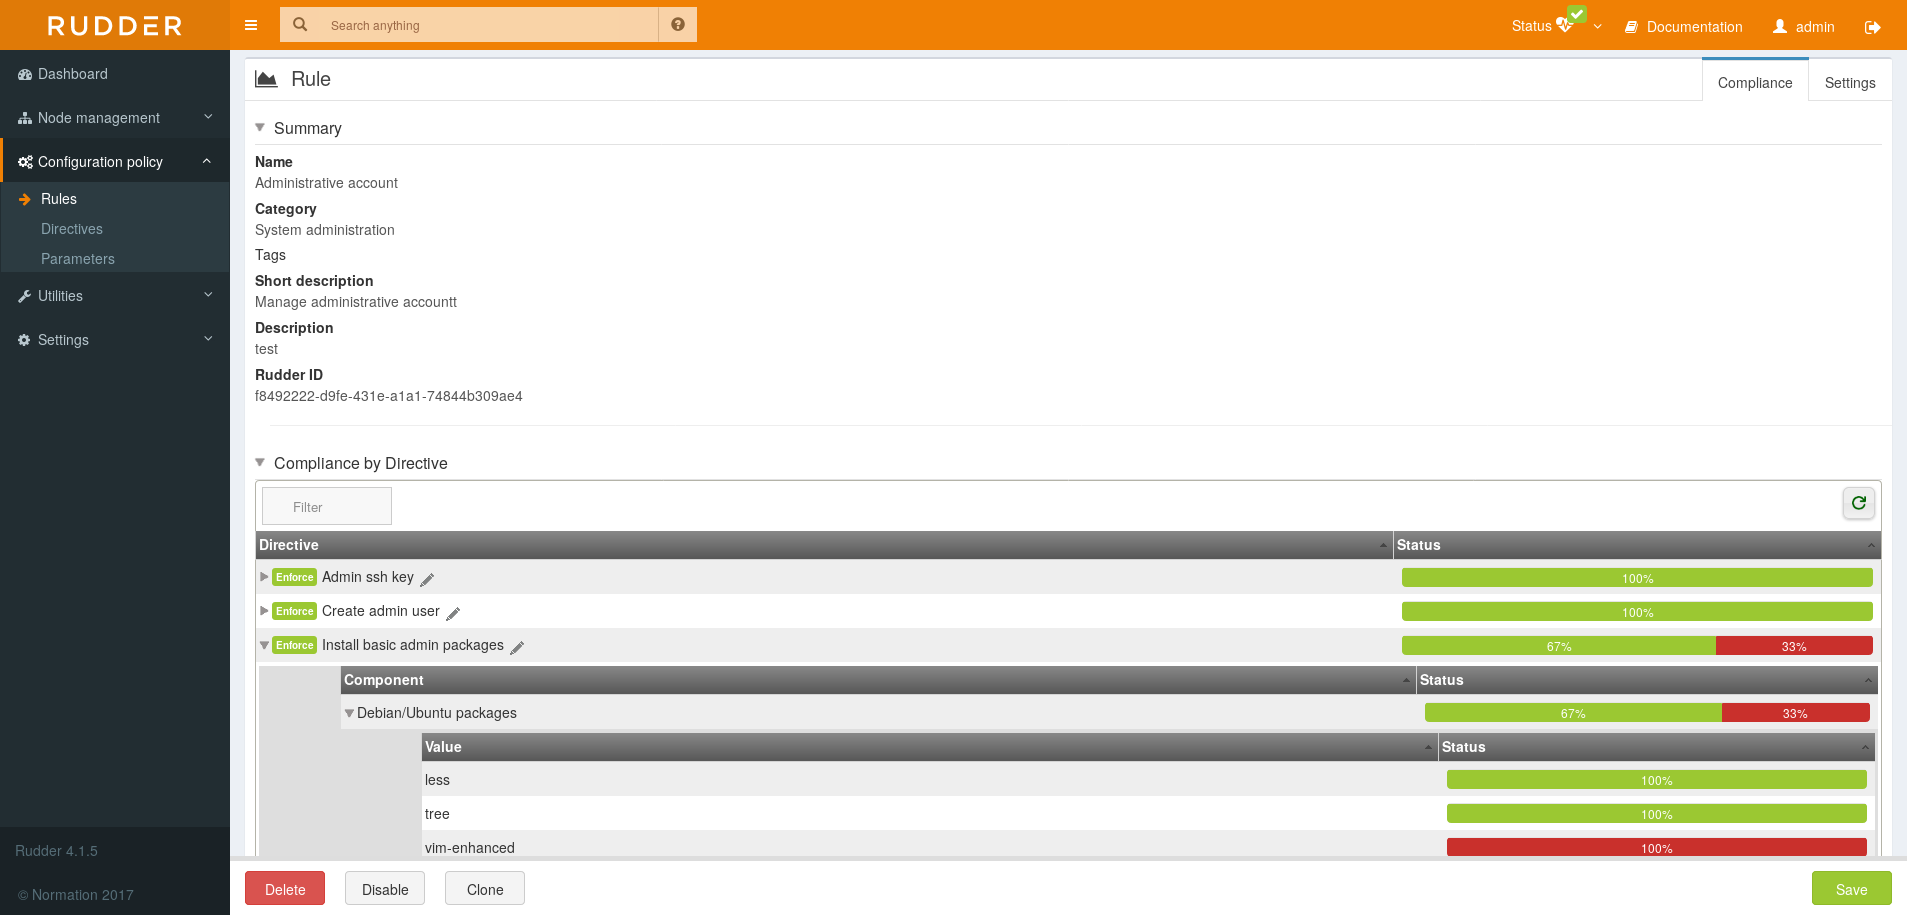
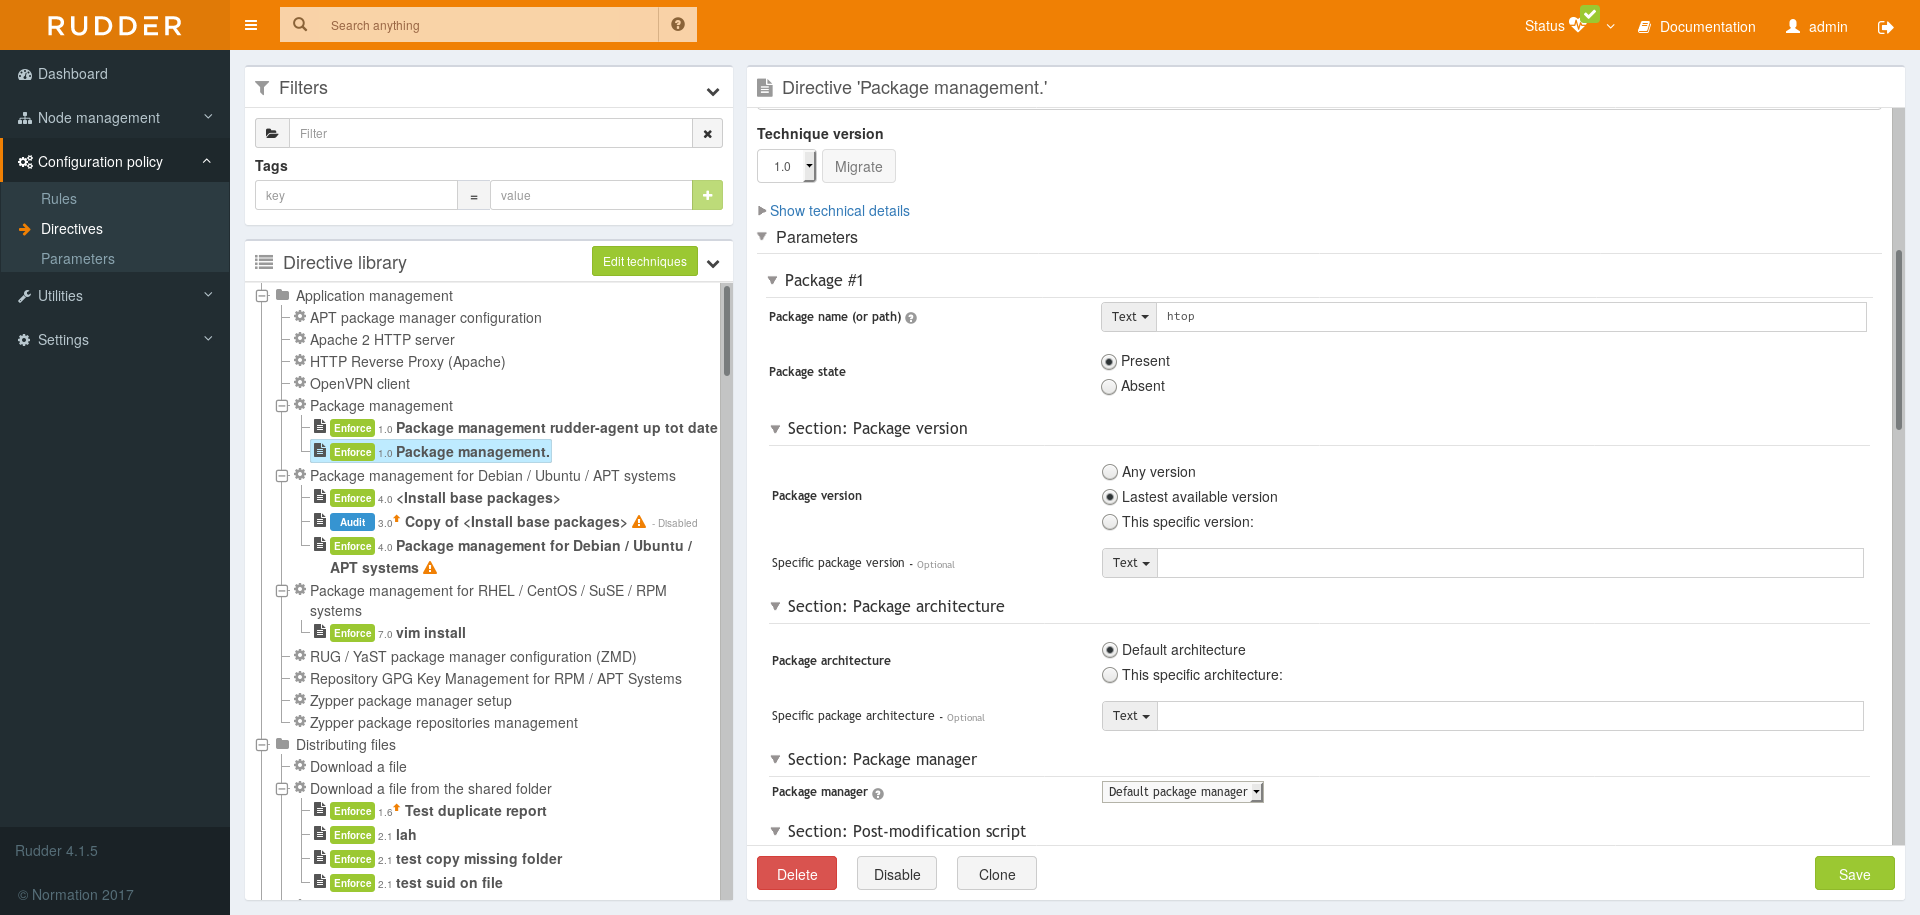
In the Configuration Management section, you can select the Techniques, configure the Directives and manage the Rules and check their compliance.
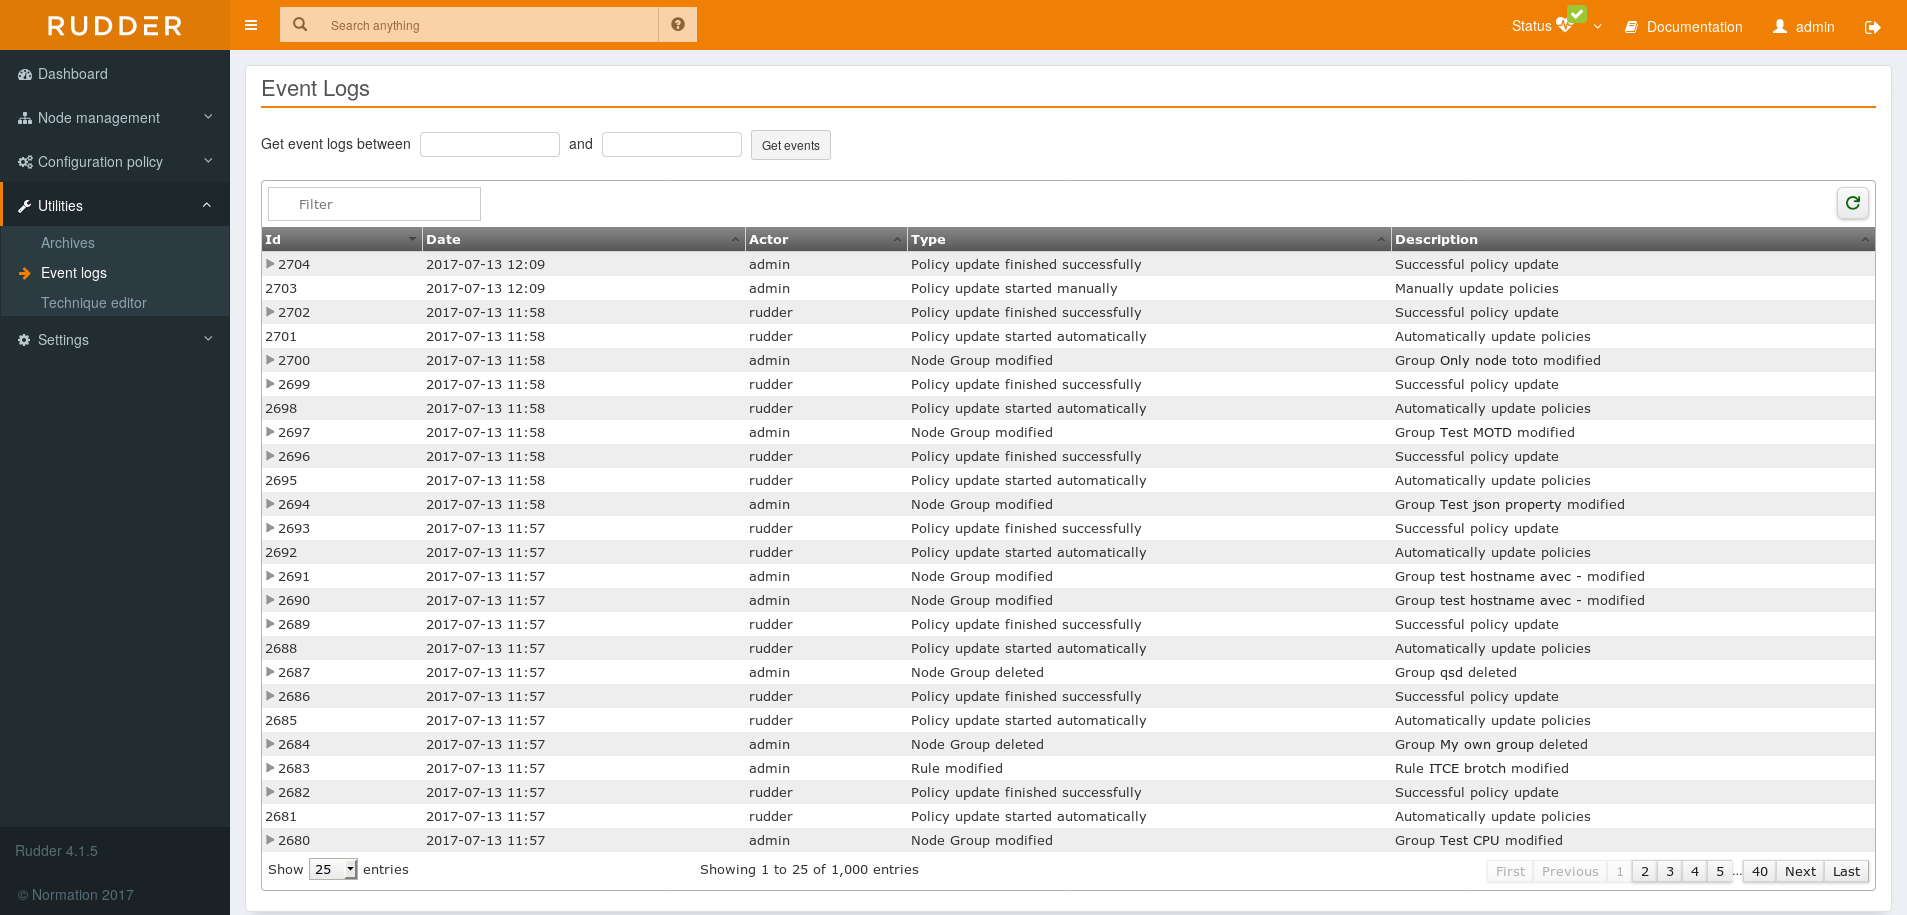
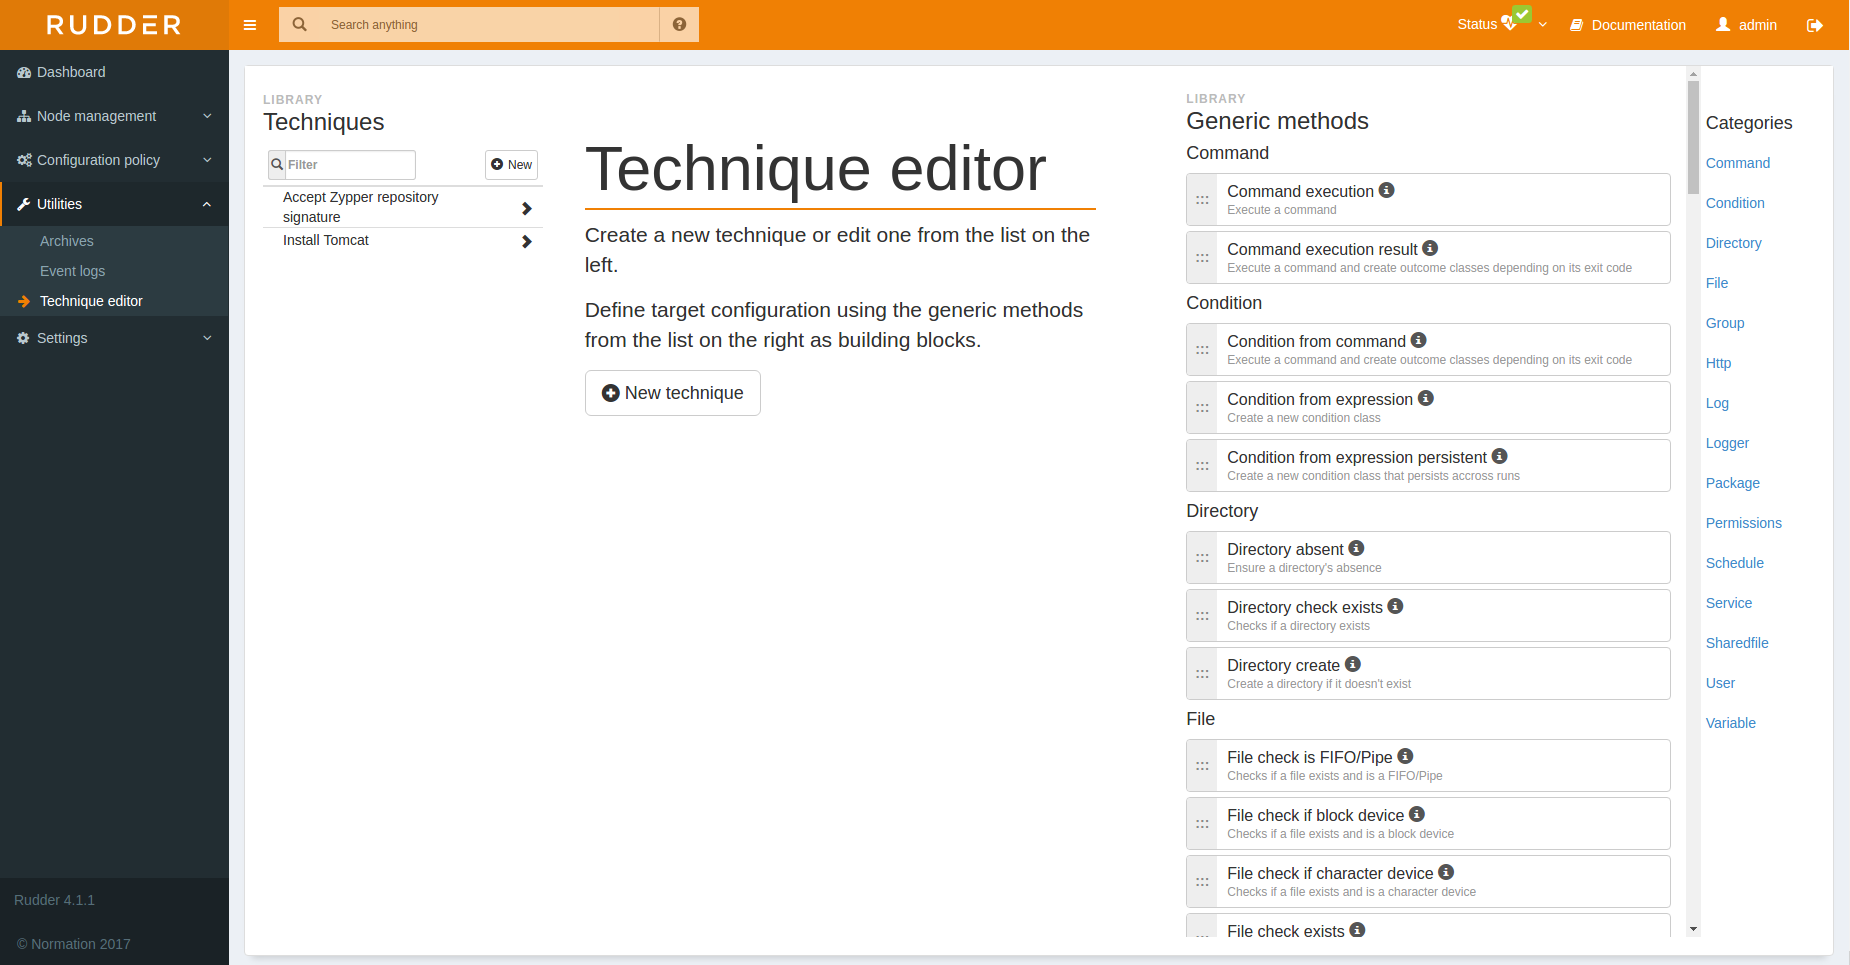
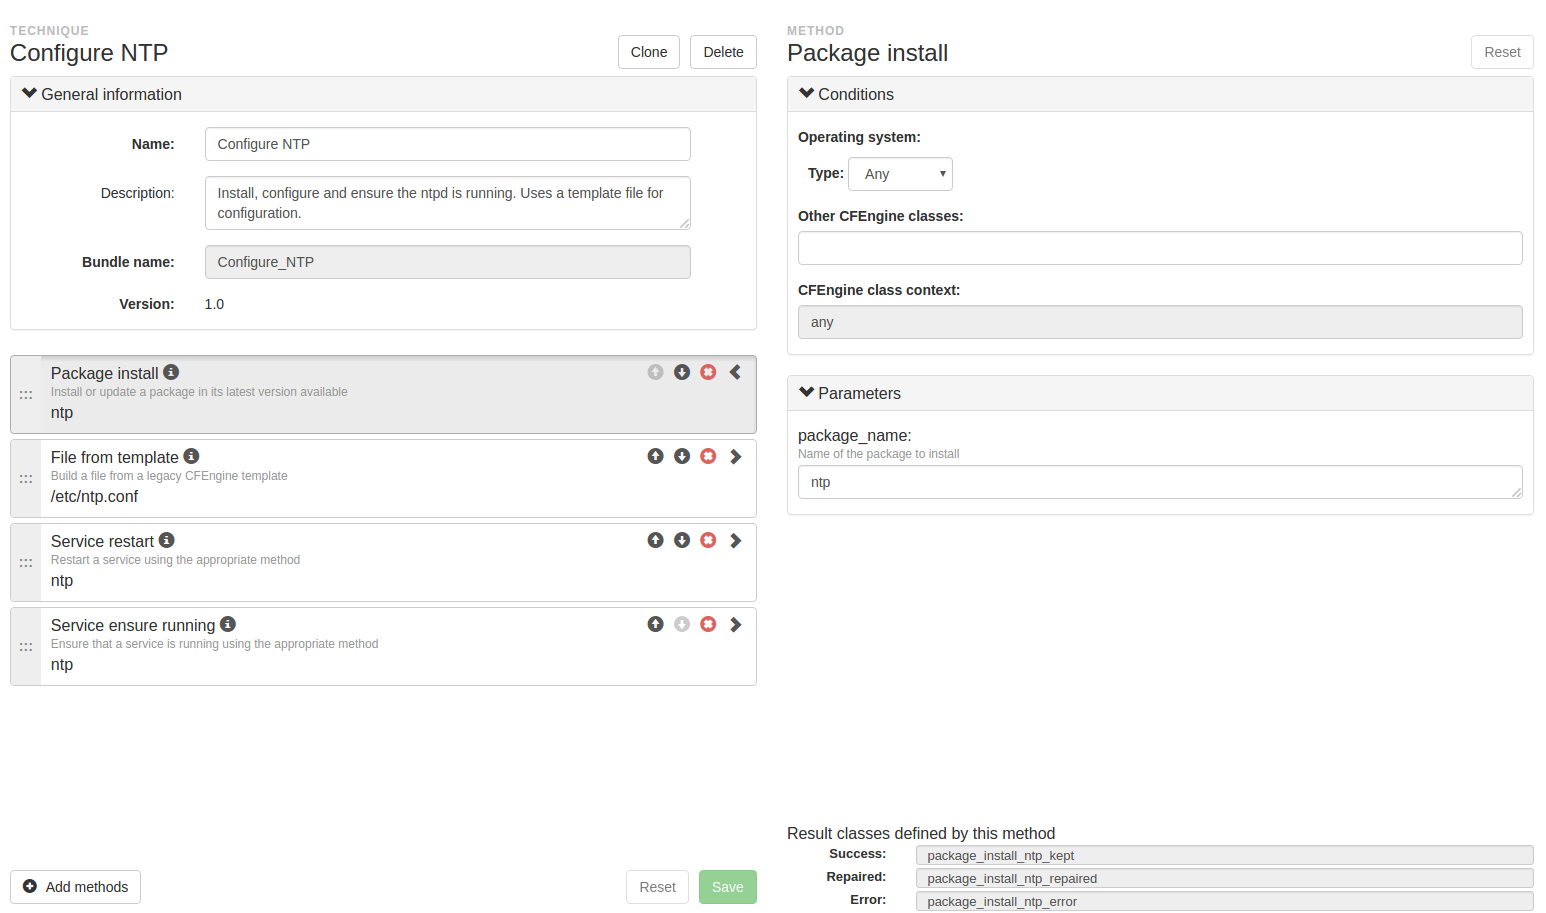
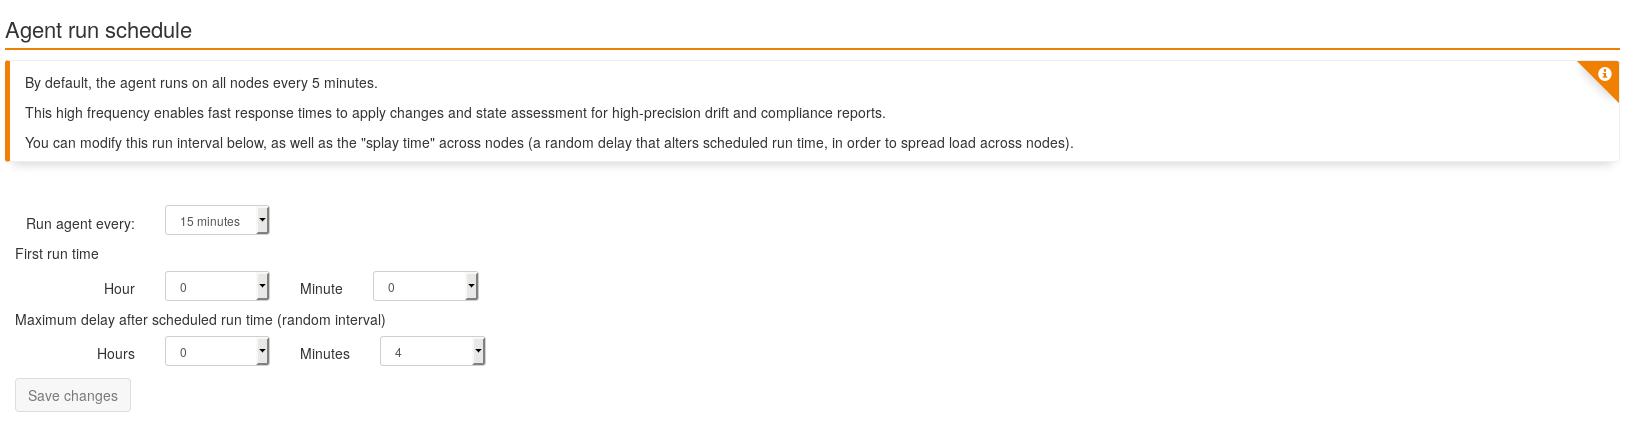
This section contains tools useful for your everyday usage of Rudder. This is where you will find the technique editor, the event logs table or the change requests if you have enabled that feature.